Food Aid: Cooking With Numbers

Japanese cuisine and statistics are two of my passions. And while I rarely indulge both at once, there’s a common thread: there are, in both, any number of ways to slice and dice things. Some of these ways are basic; others, much more refined.
Take GDP. You could hardly get more basic. To pursue the cooking analogy: let’s say you have guests for dinner. So you throw everything into your dish, fresh or rotten, sweet or sour. Hack it all into a rough gruel. Then parse it all out so that each guest gets an equal amount.
Now, this doesn’t tell you if the stuff you’ve cooked is good or bad; which guest will get what in practice; who needs how much to be sated; if some guests might feel sick from overeating; or indeed, whether some of the ingredients might set off an allergy. Theoretically you’ve fed everyone, and in a fair way at that, so sweet dreams to them.
Or maybe not. When you’re an economist working in food assistance, the metrics of access to food keep you awake at night. And with 821 million people going hungry in the world, so they should.

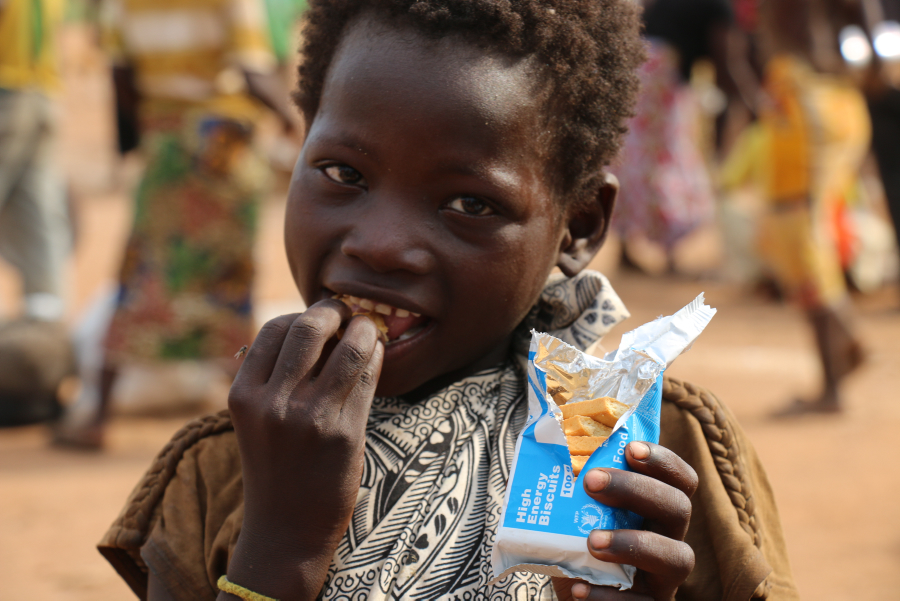
A young boy eats High Energy Biscuits in the Central African Republic. Armed groups burned down a refugee camp there in October 2018, killing several people, injuring others and leaving 27,000 people homeless again.
You can, of course, measure the per capita average calorie intake in every country — and indeed, we do. The stats tell us, for example, that each person in the rich Global North enjoys an average of 3,000 calories or more a day, while in the poorest countries the number hovers below 2,000.
This is certainly useful as far as broad indicators go. It’s far from insignificant that in the Democratic Republic of Congo, the per capita food supply is a full 300 calories short of the required 2,100. Then again, this metric is no more sophisticated than GDP — and is, in fact, largely correlated with it. It tells us, intuitively enough, that an organization like the UN World Food Programme (WFP) should be concentrating its efforts in the DRC rather than in, say, Japan. But it tells us neither how the calorie shortfall is actually distributed among Congolese citizens, nor what the nutritious content of the available calories is.
So the dicing must be much finer. The UN’s Food and Agriculture Organization (FAO) calculates what is known as a coefficient of variation (CV) of caloric consumption. CV ascribes each country a value from 0 to 1: the closer to 1, the less equal the distribution. This allows us to distinguish among nations with similar wealth indicators. Another metric, the ‘skewness’ rate (SK), maps the shape of calorie distribution around the national average. SK tells us that developed countries too have some way to go. Japan, again, is an apt example: as its life expectancy grows, undernourishment appears to be increasing among the elderly.
The further we move from the clunky logic of averages, in fact, the more we are reminded that the Sustainable Development Goals (SDGs) — in our case, Global Goal 2, which aims to end hunger and malnutrition in all its forms — are relevant to all nations, rich and poor.
Still, we must dice things further. Calories do not equal nutrients. The former matter immensely. They are pure energy. They’ll keep you going for a bit. But the latter are what allows you to grow healthily and sustain a full, productive existence. Fat. Fibre. Folic acid.

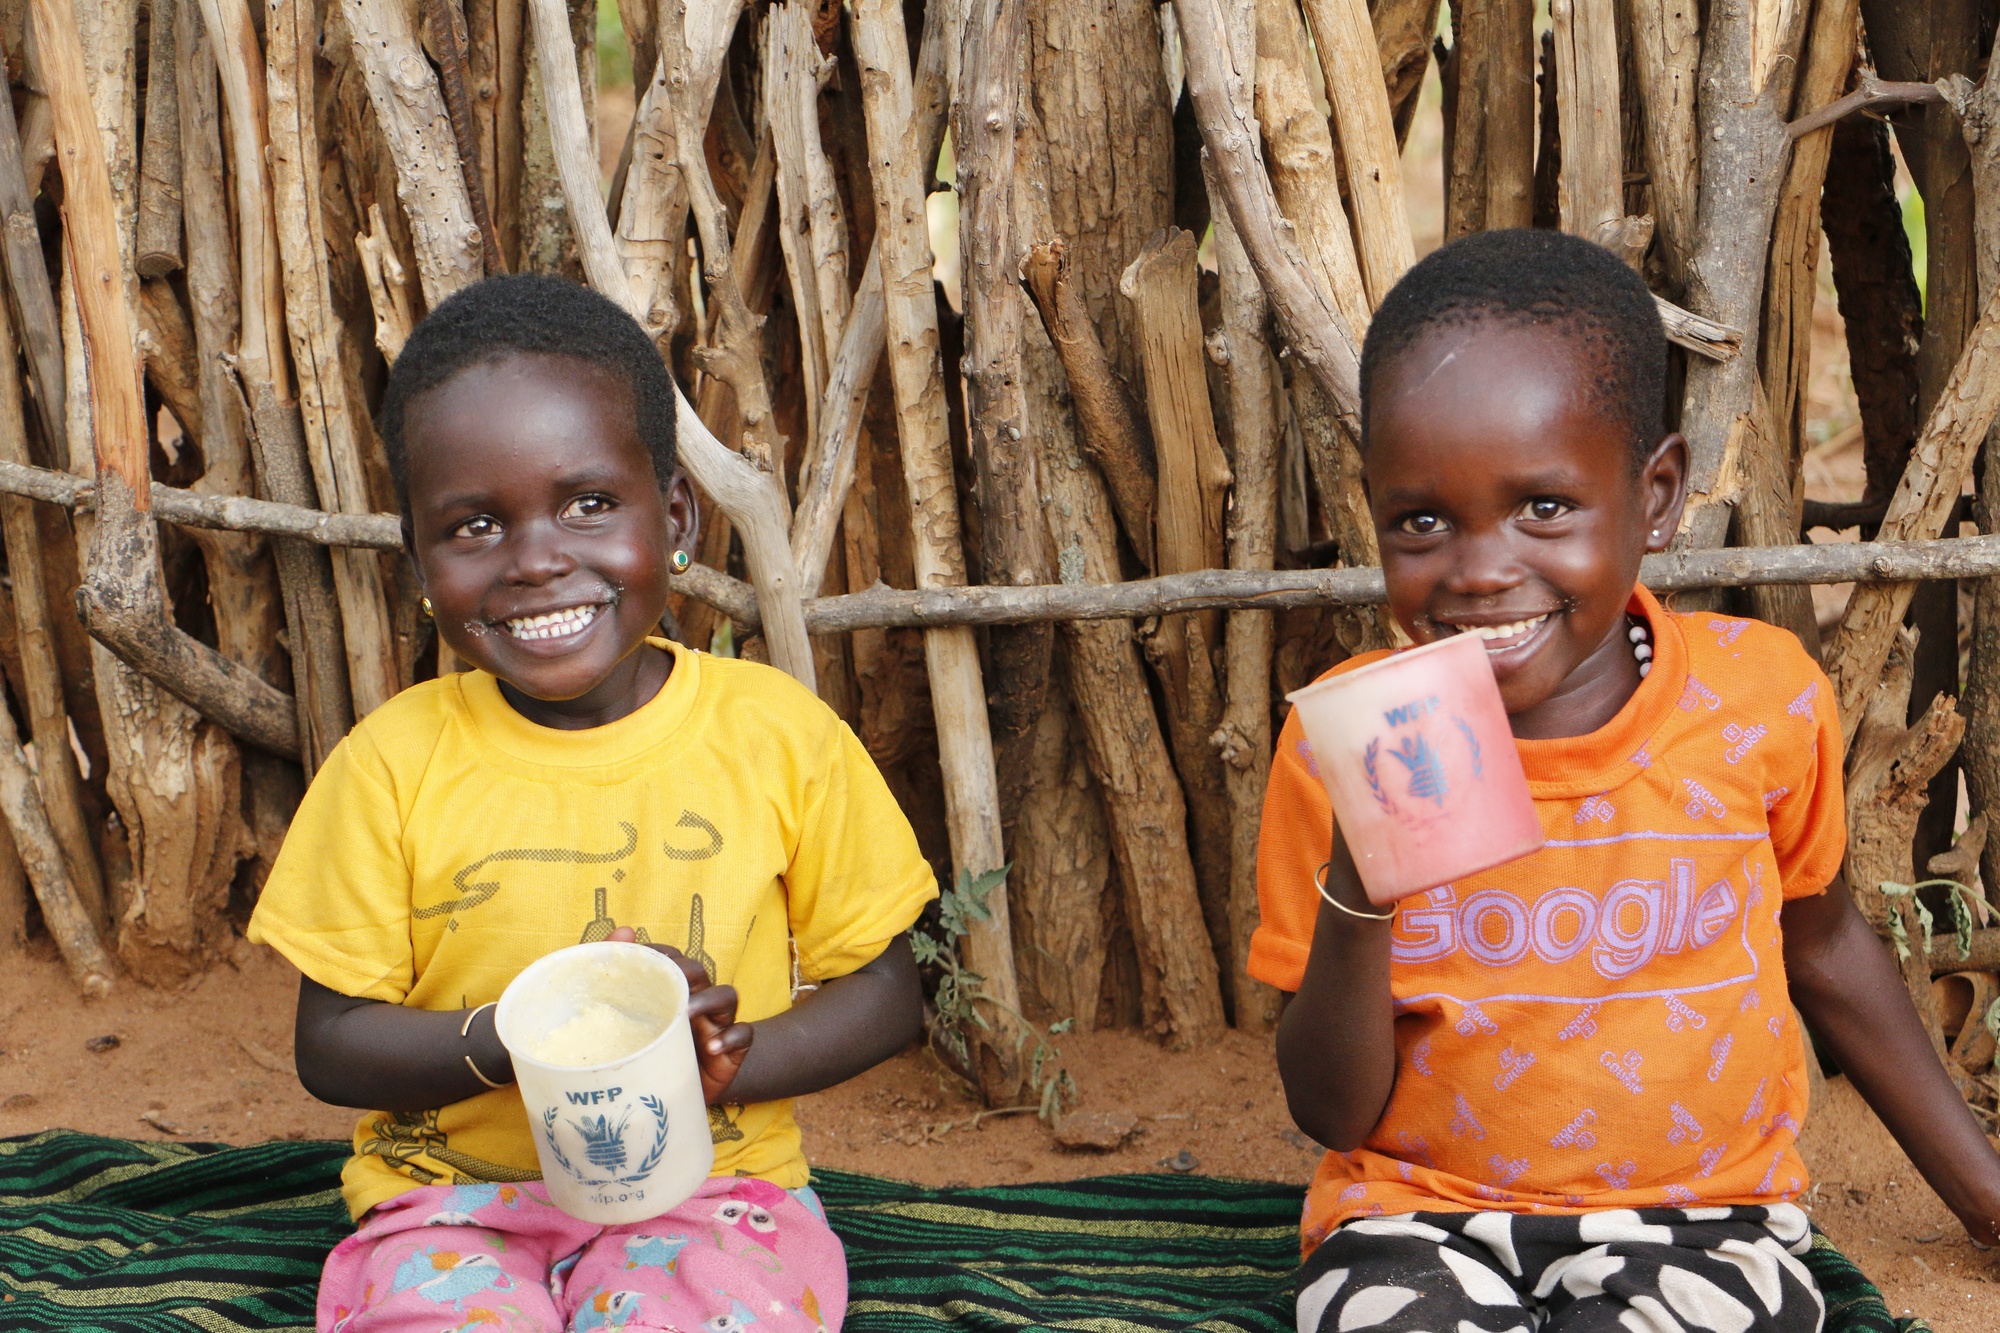
WFP provides the right food at the right time, including fortified grains and cooking oil, so people get the nutrients they need.
Measuring nutrient intake is far more complex than dividing the number of calories by the number of people. We know, for example, that fat tends to cluster in the North and needs to shift South. Then again, obesity, an insidious trigger for non-communicable diseases, cuts across upper- and middle-income nations.
To complicate things yet further: when it comes to nutrition, equality does not equal equity.
Take a family of five: father, mother, two boys aged 8 and 10, and a 15-year-old daughter. In many cultures, the mother and daughter would be tasked with the cooking, but be the last to eat — and often, they end up with the leftovers. You might think the right thing to do (apart from lending a hand in the kitchen) was to ensure each family member received an equal share of the meal. In fact, such are the teenage girl’s physiological needs that to secure an equal footing, she must get the choicest cuts. Watch number-crunchers squirm as dietary requirements cut against the grain of custom, and statistical equality parts ways with nutritional equality.
So what does this all mean when you are the world’s largest provider of food assistance, working to deliver zero hunger?
Well, it means that as well as saving lives in emergencies, you strive hard to change them. It means you increasingly give people cash to feed themselves, because this offers them better dietary choices and stimulates markets to meet their needs. It means you target a child’s first 1,000 days, the period between conception and their second birthday that is critical for their future health, longevity and productivity. It means you provide that kid with school meals later in life, to get them to class and keep them there.
It means that you issue people with digital identities, making it possible to monitor and improve their nutritional status. That you experiment with everything from drones and satellites that can map food security patterns, to hydroponics which allow refugees to grow their own food. And that, through it all, you stay awake at night doing your sums, coming at things from this angle and that angle, ruminating through them horizontally and vertically and sideways, until the day comes when hunger has nowhere to hide.
*Arif Husain is the chief economist for WFP.
This post originally appeared on the World Economic Forum website.


